Text Classification and Sentiment Analysis on Hotel Reviews
Source: Lionbridge.ai
Abstract — This study aimed to build text classification methods on the domain of hotel reviews. With this project, I wanted to understand how hotel guest reviews have an impact in the hotel business. The goal of this project is to implement classifiers that predict the rating of the reviews. These classifiers would be trained on hotel reviews from the TripAdvisor website. This project is important because guest reviews are becoming a prominent factor affecting people’s bookings/purchases. Text classification methods were applied to predict ratings using two vectorization algorithms: term frequency-inverse document frequency (tf-idf) and word count vectorizer. Finally, I implemented sentiment analysis to extract user emotions from the reviews and to identify what reviews had positive or negative feelings.
Keywords — Reviews, ratings, classification, performance, sentiment analysis.
I.INTRODUCTION
In the digital age that we are living, before making a hotel room reservation, users go online to read the reviews of the business to learn more about the accommodations of the hotel, to get a sense for how clean the rooms are, to learn about the services, security, food offerings and overall, people read reviews to see if previous guest were satisfied with their hotel reservations. Another important aspect about reviews is that it reflects actual experiences of guests. Especially for hotel booking, such user reviews are relevant since they are more actual and detailed than reviews found in traditional printed hotel guides and they are not biased by marketing (Kasper and Vela, 2012).
The focus of this study is training supervised learning text classification models to see whether or not its possible to predict reviews ratings. The dataset was scraped from TripAdvisor and contained the name of a person leaving a review, the actual user review and the rating from the top ten rated hotels. After tokenizing, lemmatize and filtering the data, I vectorized the reviews first with the term frequency-inverse document frequency (tf-idf) method, which provides insight to the weight of each word in each document and also with count vectorizer that transforms the text in vectors of the tokens counts.
The motivation of this project is to predict review ratings using the following classifications algorithms: Logistic Regression, Decision Tree, Random Forest, Gradient Boosting, AdaBoost, XGBoost, Linear Support Vector Classification and Multinomial Naive Bayes. Afterwards, I will tune the parameters of the models to maximize the model performance using a combinatorial grid search. To evaluate my results, I implemented the accuracy score and confusion matrix. Finally, I identified whenever a review expressed a positive or negative opinion, with the implementation of sentiment analysis.
II.BACKGROUND
Reviews and ratings are popular tools to support the buying decisions of consumers. These tools are also valuable for online business, who use rating systems in order to build trust and reputation in the online market. (Lackermair, Kailer and Kanmaz , 2013). Positive reviews have a constructive impact in business. A positive review often helps consumers avoid choosing a restaurant or hotel that might not meet their expectations (Bronner & de Hoog, 2011). Not only are reviews important for customers, they are also important for business owners because reviews and ratings can help business owners better understand why costumers like or complain about certain aspects of the business.
III.EXPERIMENTS/METHODOLOGY
1. DATASET DESCRIPTION
I scraped the data from the TripAdvisor website using Python programming language. The dataset contains the reviews, users and ratings from hotels in TripAdvisor located in New York.
A few characteristics of my data set are:
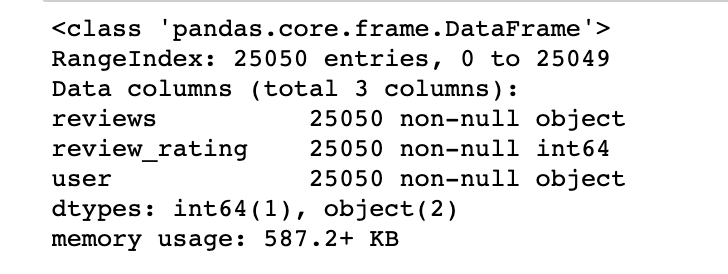
It has 25,050 entries and 3 features.
It does not have any null values.
Most of the reviews have a 5 stars that is 47% of the data. Only 7% of reviews have 1 star.
There are 22,205 unique reviews in the data which is quite diverse. The average user has contributed with 1 review to the dataframe. The top reviewer (Marck C) has contributed 13 reviews.
The maximum number of characters in a review is 2,535 and the minimum number is 195 characters. The average length of characters in a review is 469 characters.
My target value is ratings.
Table1. Characteristics of my data set.
2. TARGET FEATURE
My target feature is a review’s rating. It contains numeric values that need to be encoded as categorical values for text classification. The range of this feature is from one to five. The graph below shows that not many reviews have one or two starts. Most of the reviews have five starts.
Table 2. Frequency of Ratings.
3. DATA PRE-PROCESSING
Pre-processing the data is the process of cleaning and preparing the text for classification. I used the Python programming language to extract and to transform my dataset.
To clean the text data, I removed whitespaces, punctuation, numbers, special characters, duplicate spaces and I removed words with less than 3 characters. Afterwards, I converted the text data into tokens and then I removed the stopwords: though, the, thing and hotel because they were all irrelevant in my analysis. Finally, I tested stemming and lemmatization procedures. I decided to only use lemmatization because this technique returns a meaningful word. With this technique, I built a word frequency to see the most frequent tokens in the data set. Finally, I created a word cloud graph to visualize the word frequencies. The most used words in the reviews are park, view, stary, central and location.
Table 3. Shows the top twenty words used in the rewies.
Table 4. Shows the most important tokens in the dataset.
4. VECTORIZATION METHODS
There are many types of vectorization methods you can use to encode your text data. According to the scholars, Bojanowski, Grave, Joulin and Mikolo, word vectorization or also called word embedding, is a technique in Natural Language Processing that transforms tokens into numbers. It maps words or phrases from vocabulary to a corresponding vector of real numbers.(Bojanowski, Grave, Joulin, Mikolo,2017) This step is necessary in text classification because machine learning algorithms can not understand text data. In this project, I implemented two vectorization methods. I first used count vectorization, which is the most basic way to represent text data numerically. The vectors are created by counting how many times a word appears in a document, as a consequence the final vector is highly dimensional. Unfortunately, this method does not provide us with any semantic or relational information. Afterwards, I implemented a more sophisticated method because I wanted to see which one of these two methods worked better for the dataset.
I implemented the Frequency-Inverse Document Frequency (FT -IDF) method, which reflects how important a word is to a document. FT -IDF are word frequency scores that try to highlight words that are more interesting. Finally, The data was divided into training (70% random sample), validation (15% random sample) and testing sets (10% random sample).
5.MULTICLASS CLASSIFICATION AND BINARY CLASSIFICATION
In this project, I wanted to test the best way to do classification of my target instances. I started with multiclass classification where my target value included five categories, from one rating to five ratings, however, the results of this classification were not very strong and I knew they could be improved.
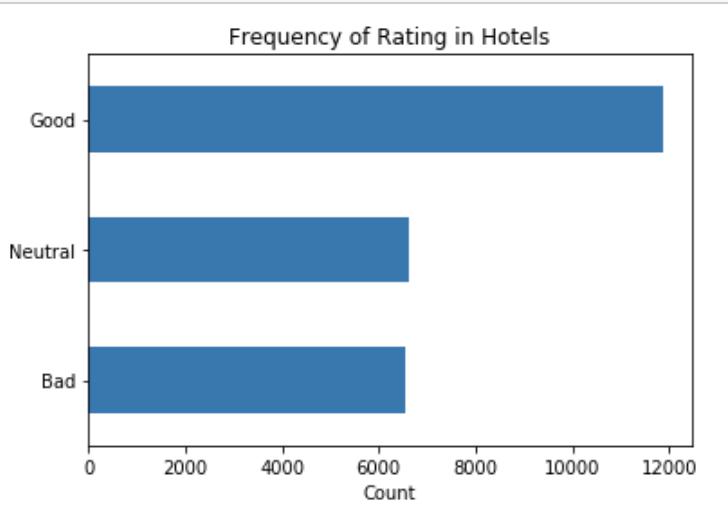
I then decided to divide the target value into three categories. In my dataset, there were a lot more ratings of fours and fives than ones, two and three ratings. Because of this, I set the ratings of one, two, and three as ‘bad’, the ratings of four were set as ‘neutral’, and the ratings of five as ‘good’. The new target instance contains three categories with 47.00% as ‘good’, 26.00% as ‘neutral’ and 26.00% as ‘bad’.
Table 5. Shows the partition of the target value into three categories.
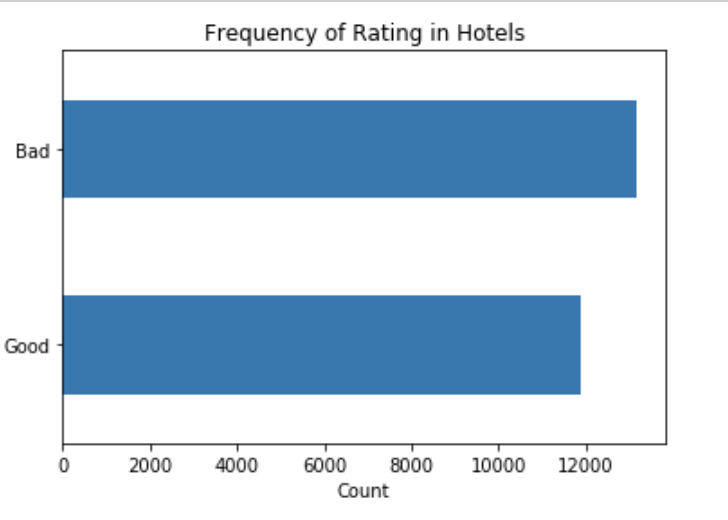
Finally, I wanted to test a binary classification to see if the accuracy of the model improved. I decided to encode five ratings as ‘good’ and the rest of the ratings as ‘bad’. The new target instance contained two categories with 47.00% as ‘good’ and 52.00% as ‘bad’.
Table 6. Shows the partition of the target value into two categories.
6. DATA MINING ALGORITHMS
In this project, I implemented several data mining classification algorithms. I started with Logistic Regression as a baseline model. Logistic Regression is a simple algorithm and it has a reasonable change of providing good results. Afterwards, I implemented a single model of a Decision Tree algorithm. Afterwards, I built ensemble methods because I knew that they would improve my results by combining several models. Ensambles methods tend to have a better predictive performance compared to a single model. The ensembles that I used were: Random Forest, Gradient Boost, AdaBoost and XGBoost. I also implemented another supervised machine learning algorithm, Support Vector Machine abbreviated as SVM, which can be used for both regression and classification tasks. In this project, SVM was used only for classification. According to my research, it seems that SVM works better with text data and produces higher accuracy compared with other algorithms, with less computation power. The last algorithm that I built was Multinomial Naive Bayes, a specialized version of Naive Bayes that is designed for text documents. This algorithm works well for text data which can easily be turned into counts.
I knew that the accuracy of these models could improve so I tuned the parameters for each classifier using a combinatorial grid search. For this task, I used a python library called GridSearchCV that finds the best combination of parameters for a given model. Grid search is sometimes referred to as an exhaustive search because it tries every single combination and as a consequence it’s computationally expensive. Tuning the parameters for each classifier enhances their performance by approximately 10%.
7. EVALUATION METRICS
To evaluate my results, the metrics that I used were: accuracy and confusion matrix for each of my classifiers.
8. SENTIMENT ANALYSIS
Scholars Bakshi and Kaur defined sentiment analysis, also called as opinion mining, as a text mining technique that could extract emotions of a given text, whether it is positive, negative or neutral, and return a sentiment score (Bakshi and Kaur, 2016). For this project, I used the algorithm called VADER (Valence Aware Dictionary and Sentiment Reasoner) designed for sentiment analysis. VANDER is a lexicon and rule-based sentiment analysis tool that is specifically attuned to sentiments expressed in social media (Hutto, C.J. & Gilbert, Eric, 2014). VADER uses a combination of a sentiment lexicon, a list of lexical features (e.g., words) which are generally labelled according to their semantic orientation as either positive or negative (Heather and Joyne, 2018).
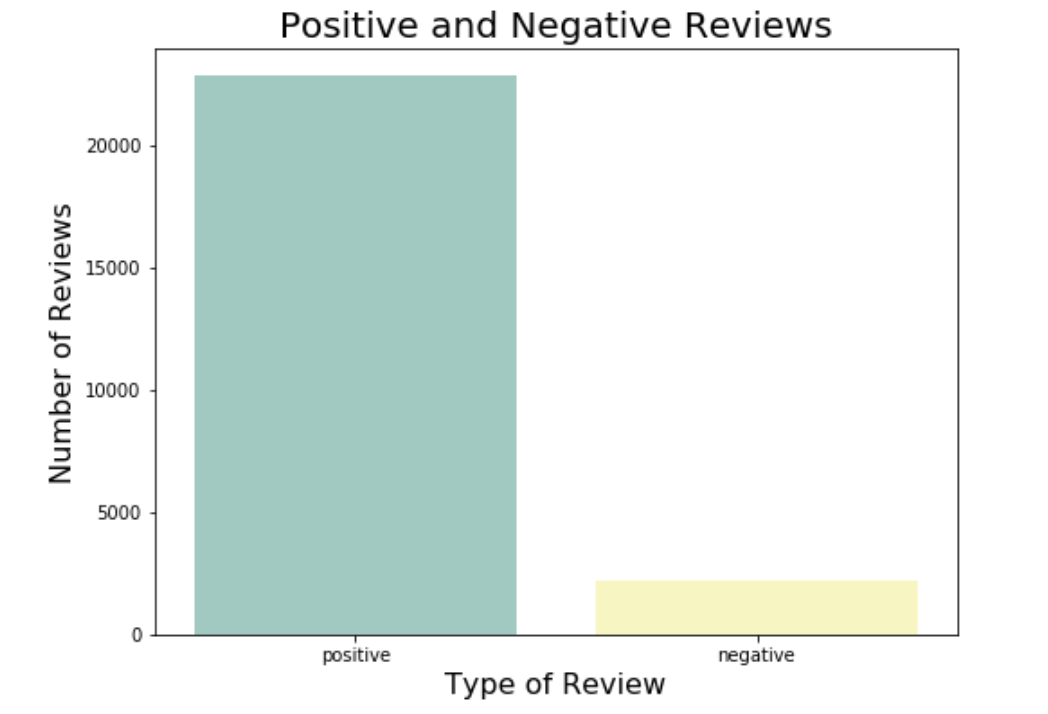
Once I built this model, it generated three polarity scores: positive, negative and compound for each review. The compound score is a comprehensive assessment of the first two scores. For this project, I set a threshold of the compound score to identify the sentiment. I set the threshold as ±0.2. If the compound score of a review is greater than 0.2, then the review is positive. If the compound score of a review is less than 0.2, then the review is negative. The results were 91% of the reviews positive and only 0.8% of the reviews were negative.
Table 7. Shows the amount of positive and negative reviews.
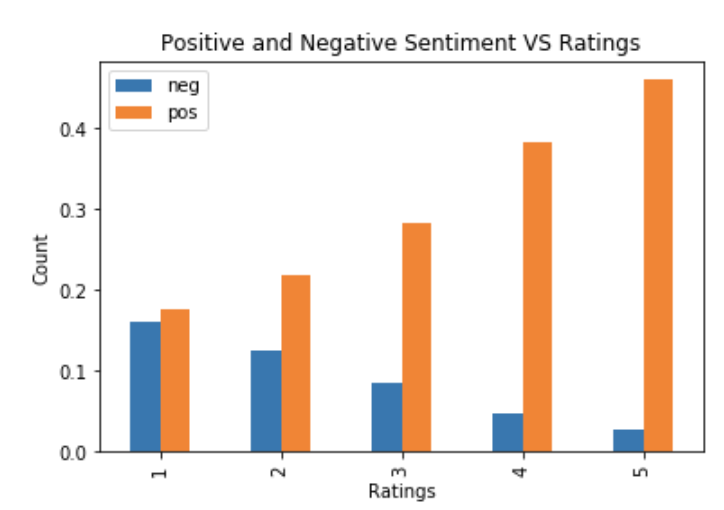
However these results are not conclusive, if they are not associated with the actual ratings of the reviews. The graph below shows the comparison of negative and positive sentiment scores and the ratings of the reviews. The negative sentiment score decreased from one to five ratings. On the other hand, the positive sentiment score increased from one to five ratings. In an ideal case, reviews with ratings of one and two would have a much higher percentage of negative sentiment than positive sentiment. However, this graph shows that rating one has a higher percentage of a positive sentiment score than a negative score. We can also see this with rating number two.
Table 8. Comparison of positive and negative sentiments and the reviews ratings.
IV. RESULTS
WORD COUNT VECTORIZATION
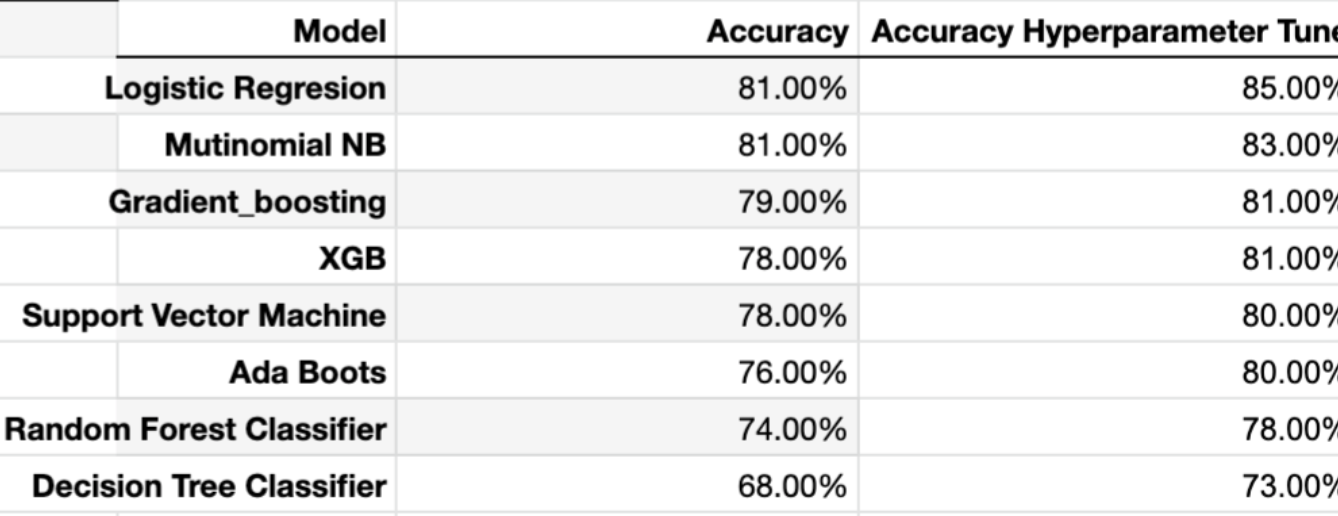
After implementing each of the classifiers and tuning the parameters for five categories, tree categories and two categories, the classifier with the higher accuracy score was Logistic Regression with 85% accuracy rate. The accuracy rate of all classifiers improved when the partition of target values decreased.
Multiclass classification performed poorly in this dataset. The classifier with higher accuracy score was Multinomial Naive Bayes with a 65% accuracy rate after tuning the parameters. When I divided the target value into three categories the accuracy score increased around 10%. Now the classifier with higher accuracy score was Multinomial Naive Bayes with a 77 % accuracy rate after tuning the parameters. Finally, when I implemented binary classification, the accuracy of the classifiers improved to approximately 13%, showing the best accuracy score for this dataset. The classifier with higher accuracy score was Logistic Regression with 85% of accuracy rate after tuning the parameters.
Term Frequency-Inverse Document Frequency
For this dataset, Term Frequency Inverse Document Frequency (TF-IDF) performed better than the word count vectorization method. Similarly to how it happened with the word count method, the accuracy rate of all classifiers improved when the number of target values decreased. The best accuracy score for five categories was Support Vector Machine with a 62% accuracy rate after tuning the parameters. For three categories, the classifier with higher accuracy score was Logistic Regression with a 78% accuracy rate after tuning the parameters. Finally, the classifier Support Vector Machine with binary classification achieved the best performance with 87% of accuracy rate after tuning the parameters.
V. RELATED WORK
This project is mainly related to the research of text classification on reviews. According to the scholar Joachims, the goal of text classification is the automatic assignment of documents to a fixed number of semantic categories (Joachims, 1997). Other researchers indicate that text classification plays an important role in the areas of information extraction and summarization, text retrieval, and question answering (Ikonomakis, Kotsiantis and Tampakas 2005).
In terms of reviews, previous research found that they are one of the most important consideration elements for customers to make a purchase. For new customers, the opinions of other customers about the products they are considering are actually more valid than the publicity, marketing and advertising of the product (Filieri, Alguezaui, & McLeay, 2015). In addition, reviews show the real experience of the reviewers. Reviews express customers’ feelings about their experience. Reviewers are free to talk in a negative or positive way about their experience (Wattanacharoensil, Schuckert, Graham, & Dean, 2017).
VII. CONCLUSION
In this study, I presented the results for text classification and sentiment analysis on hotel reviews. I confidently identified which was the best classifier that can successfully predict the rating of reviews and concluded that for this particular dataset the TF-IDF vectorization performs better than the word count method. Binary classification demonstrated the best approach for this project. After testing all the classifiers, the one with higher accuracy score was Support Vector Machine which achieved a 87% accuracy rate after tuning the parameters. Finally, I tentatively conclude that in this project, most of the hotel reviews had a positive sentiment.
In future work, it will be interesting to collect more reviews from other cities in the USA, since this project only contains reviews from hotels in NYC, to make a global prediction and to compare the results. In addition, I would like to collect more data and implement a Neural Network to see if the accuracy of the model improves. Finally, instead of focusing on one type of service like I did in this project, I would like to use other types of services like restaurants or bars and other types of source, for example Yelp.
VIII. APPENDIX
Table 9. Multi class word count vectorizer accuracy score.
Table 10. Three classes word count vectorizer accuracy score.
Table 11. Binary classification word count accuracy score.
Table 12. Multiclass TF IDF accuracy score.
Table 13.Three classes TF IDF accuracy score.
Table 14. Binary classification TF IDF accuracy score.
Table15. Logistic Regression confusion matrix.
Table 16. Support Vector Machine confusion matrix.
IX.REFERENCES
M. Ikonomakis, S. Kotsiantis, V. Tampakas, “Text Classification Using Machine Learning Techniques”, Wseas Transactions
R. K. Bakshi and N. Kaur, “Opinion mining and sentiment analysis,” 2016 3rd International Conference on Computing for Sustainable Global Development (INDIACom), New Delhi, 2016, pp. 452–455.
Durmaz,O.Bilge, H.S “Effect of dimensionality reduction and feature selection in text classification ” in IEEE conference ,2011, Page 21–24 ,2011.
Hutto, C.J. & Gilbert, Eric. VADER: A Parsimonious Rule-based Model for Sentiment Analysis of Social Media Text. Proceedings of the 8th International Conference on Weblogs and Social Media, ICWSM 2014.
Kasper W., Vela M. (2012) Monitoring and Summarization of Hotel Reviews. In: Fuchs M., Ricci F., Cantoni L. (eds) Information and Communication Technologies in Tourism 2012. Springer, Vienna
Joachims, T. (1997). Aprobabilistic analysis of the Rocchio algorithm with TFIDF for text categorization. Machine Learning: Proceedings of the Fourteenth International Conference (ICML ’97) (pp. 143–151).
Batrinca, B., Treleaven, P.C. Social media analytics: a survey of techniques, tools and platforms. AI & Soc 30, 89–116 (2015)
Newman H., Joyner D. (2018) Sentiment Analysis of Student Evaluations of Teaching. In: Penstein Rosé C. et al. (eds) Artificial Intelligence in Education. AIED 2018. Lecture Notes in Computer Science, vol 10948. Springer, Cham
Lackermair, Georg, Daniel Kailer and Kenan Kanmaz. “Importance of Online Product Reviews from a Consumer’s Perspective.” (2013).
Shi, Y., Xi, Y., Wolcott, P., Tian, Y., Li, J., Berg, D., Chen, Z., Herrera-Viedma, E., Kou, G., Lee, H., Peng, Y., Yu, L. (eds.): Proceedings of the First International Conference on Information Technology and Quantitative Management, ITQM 2013, Dushu Lake Hotel, Sushou, China, 16–18 May, 2013, Procedia Computer Science, vol. 17. Elsevier (2013)

